| :. Home | :Subscribers Login | .: Testimonials | :: Links |
 |
|
|
|||||
|
|
|
|
|
|
Elliott Wave Forecast for Stock Market DeclineThe following charts were posted on the members site forecasting the 2007-2008 crash in the markets. These Elliott Wave forecasts for a stock market decline include charts the DOW, Nasdaq and the S&P500. Elliott Wave Charts forecasting the 2007-8 stock market declineDOW - Sep 4th 2007This DOW Chart was posted on our members page when we were close to a top.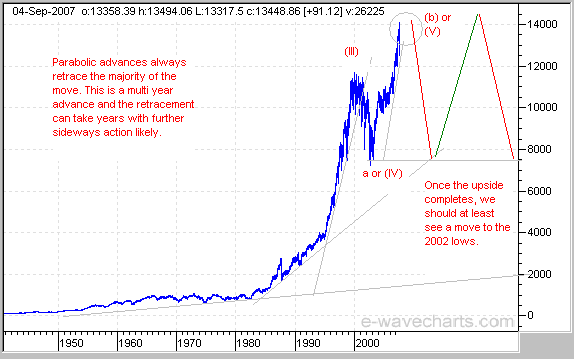
DOW - Oct 10th 2007 - TOPThis DOW Chart was posted on our members page. We called the top the next day. The stock market decline began after this Elliott Wave forecast for a top.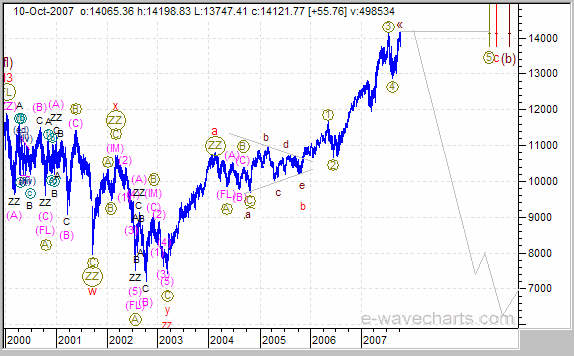
DOW - May 19th 2008 - Wave (2) TopThis DOW Chart was posted on our members page when we called the May 19th 2008 wave (2) top. The stock market decline began after this Elliott Wave forecast for a top.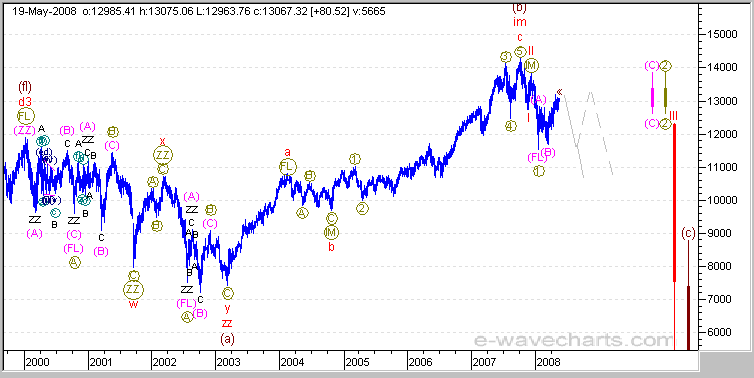
DOW - Oct 10th 2008This DOW Chart was posted on our members page when our forecast called for further downside to complete the decline.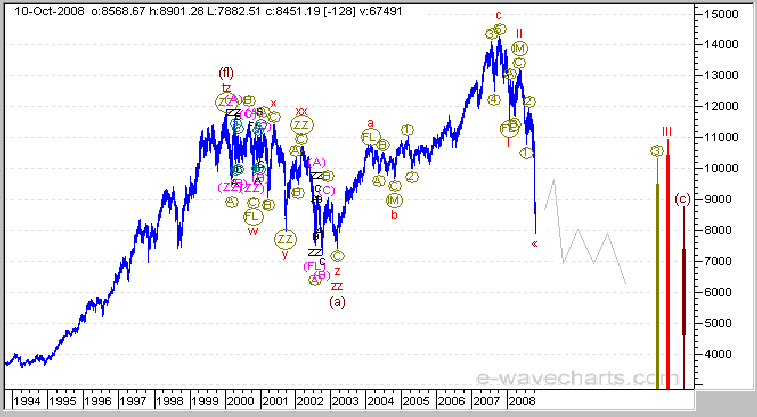
Nasdaq - Oct 10th 2007 - TopThis Nasdaq Chart was posted on our members page. We called the 2007 top the next day. The stock market decline began after this Elliott Wave forecast for a top.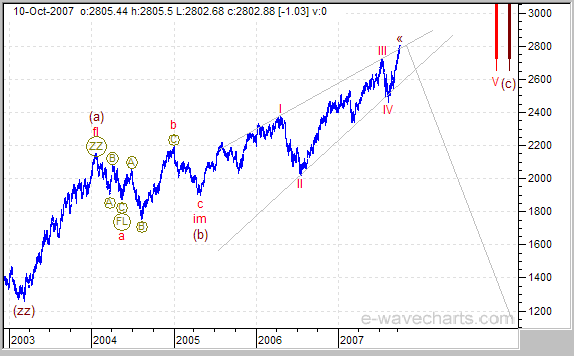
Nasdaq - May 19th 2008 - Wave (2) TopThis Nasdaq Chart was posted on our members page when we called the May 19th 2008 wave (2) top. The stock market decline began after this Elliott Wave forecast for a top.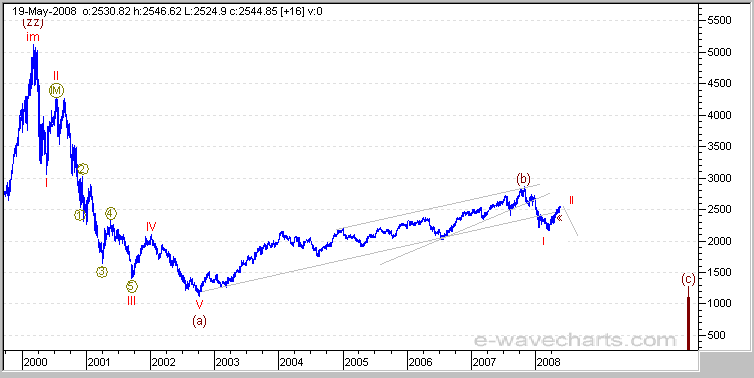
S&P 500 - May 19th 2008 - Wave (2) TopThis S&P 500 Chart was posted on our members page when we called the May 19th 2008 wave (2) top. The stock market decline began after this Elliott Wave forecast for a top.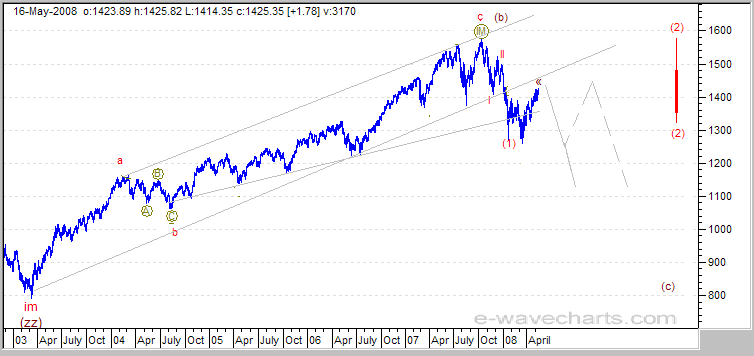
VIX - New Cycle of Volatility - Nov 9th 2007 - Near TopThis VIX Chart was posted on our members page to support our call for the Oct 2007 top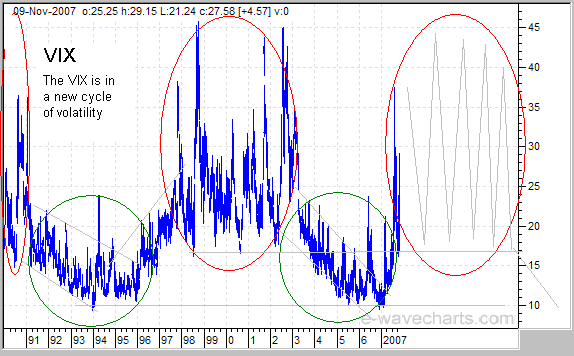
The Elliott Wave Forecast offers analysis for the DOW, Nasdaq, S&P500, Crude, Natural Gas, Gold, Silver, HUI, Euro and the USD.Back to Home Page
|