|
|
|
Elliott Wave Forecast
|
Market Overview |
DOW |
CRUDE OIL |
GOLD SILVER |
USD |
BITCOIN |
|
Short Term (Week - Month) |
Neutral2Top |
Bearish |
Bullish |
Neutral/Bullish |
Bearish |
|
Medium Term (1-6 Months) |
Bearish |
Bullish |
Bullish |
Bearish |
Bearish |
|
Long Term (6 Months-Year) |
Bearish |
Bearish |
Bullish |
Bearish |
Bearish |
|
Dec 10 2025
|
!!! NEW !!! See link below in left column for FREE Daily Natural Gas charts - NG or UNG
Silver Long Term Charts - A forecast for a triangle breakout - Feb 27th 2024
The current price is over $64 and it is going higher in a parabolic advance.


DOW Long Term Chart - Comparison of the 1987, 2000, 2007, 2020, 2022 and 2025 crashes - Sep 14th 2025
When and how deep will the next one be?

Nasdaq chart - Another parabolic move - Sept 15 2025

Over years of Elliott Wave Forecasts and Analysis on the Web.
The subscription price still remains the same, at $19.99 / month.
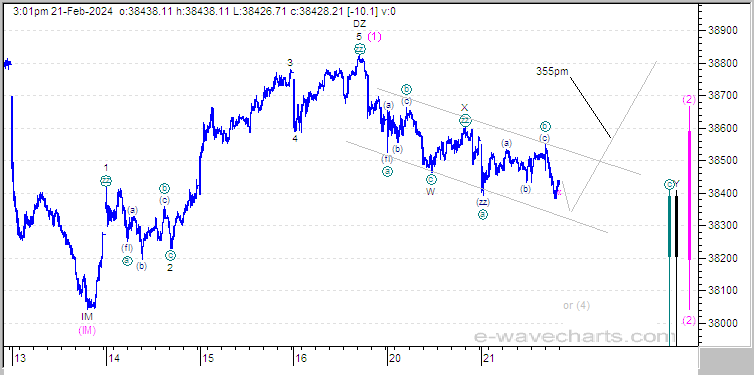
DOW Elliott Wave Forecast for a bounce expected at 3PM on Feb 21 2024
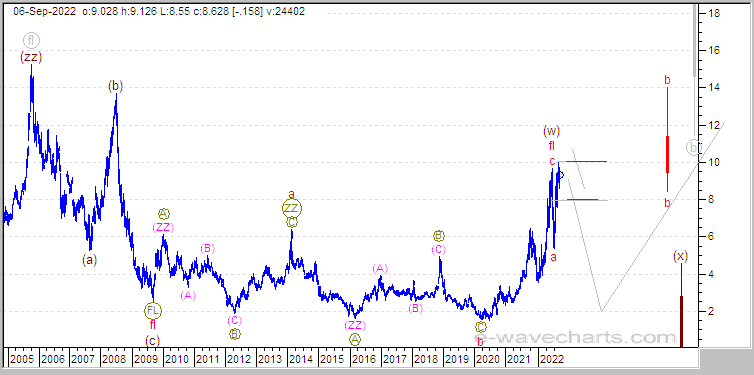
Natural Gas Top - Elliott Wave Forecast for the completion of wave b up on Sept 6 2022.
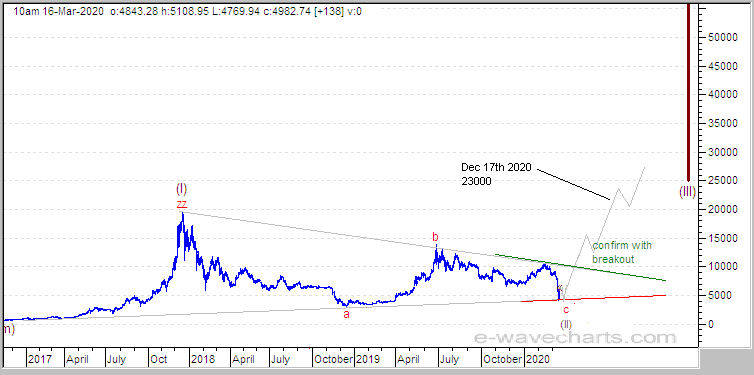
Bitcoin has Bottomed. A Bullish Elliott Wave Forecast for Bitcoin - Mar 16th 2020
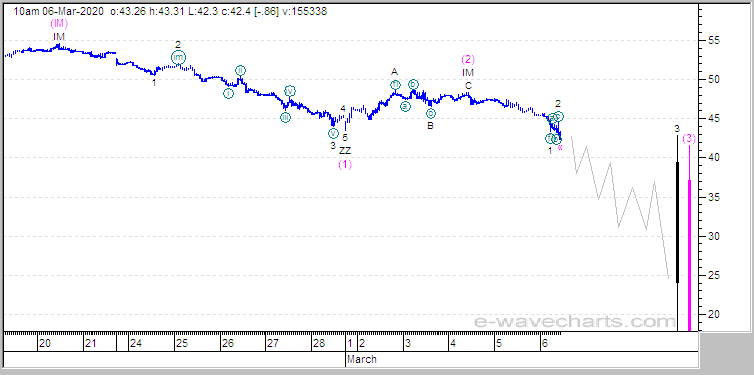
Crude- Elliott Wave Forecast before the crash in Crude prices - Mar 6th 2020
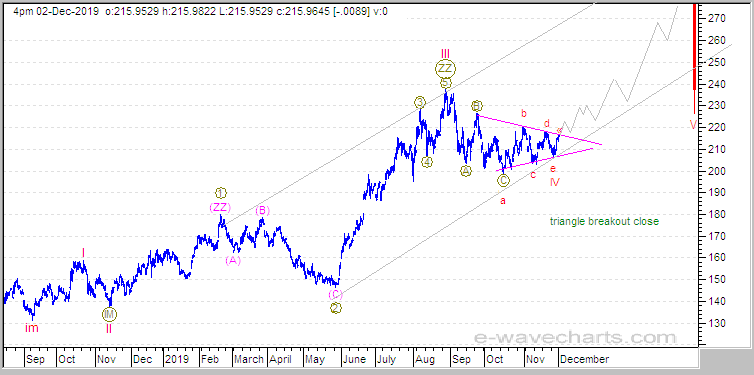
HUI- Gold stocks - Elliott Wave Forecast for a bullish Triangle breakout - Dec 3rd 2019
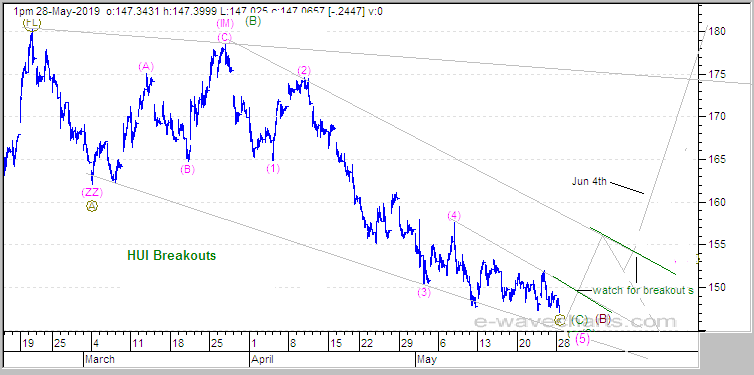
HUI- Gold stocks - Elliott Wave Forecast for a bullish breakout - May 28th 2019
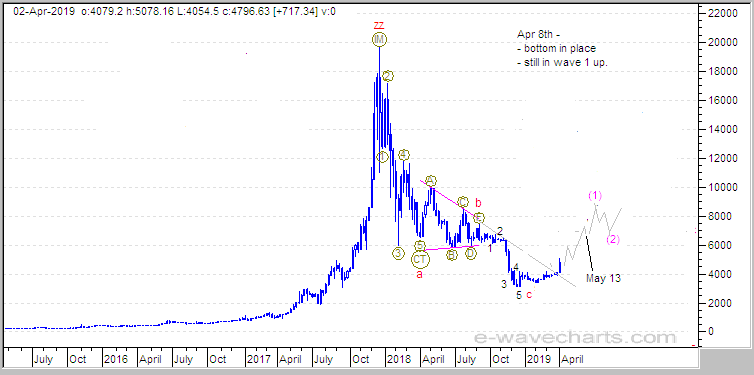
Bitcoin has Bottomed. A Bullish Elliott Wave Forecast for Bitcoin after the confirmation of wave c down - Apr 2019
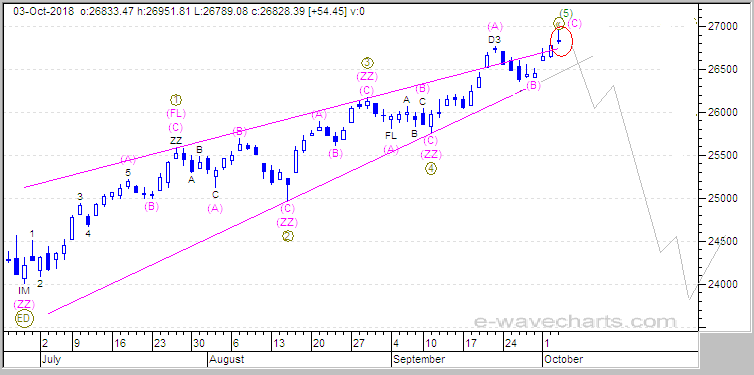
DOW - Elliott Wave Forecast for the completion of wave (5) up before Oct-Dec 2018 correction - Oct 3rd 2018
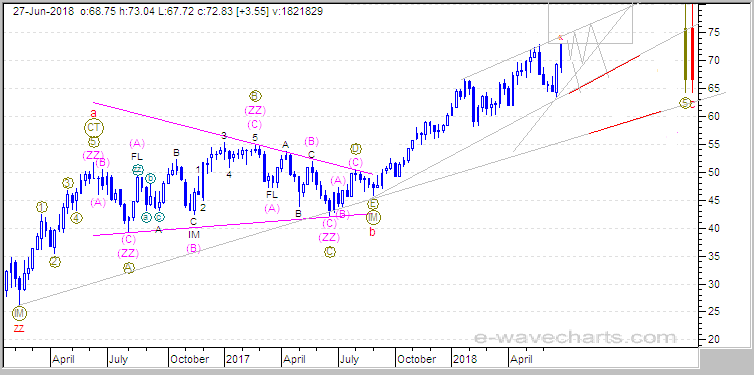
Crude - Elliott Wave Forecast in wave (5) up - Posted - Jun 27th 2018
The forecast price and top was attained on Oct 3rd 2018.
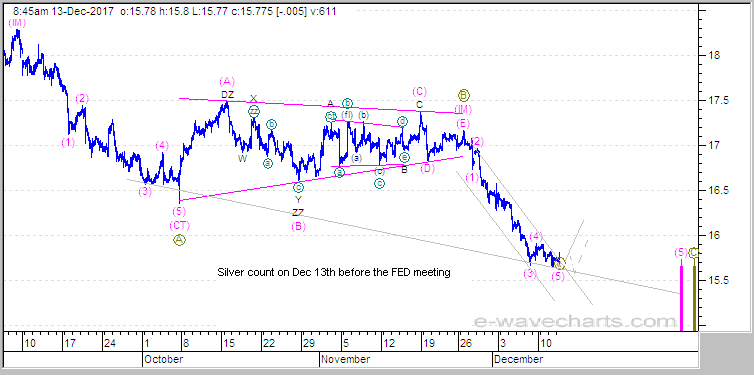
Silver - Elliott Wave Forecast for a bottom in wave (C) down before a Fed meeting and after completing a corrective wave (B) triangle - Dec 13th 2017
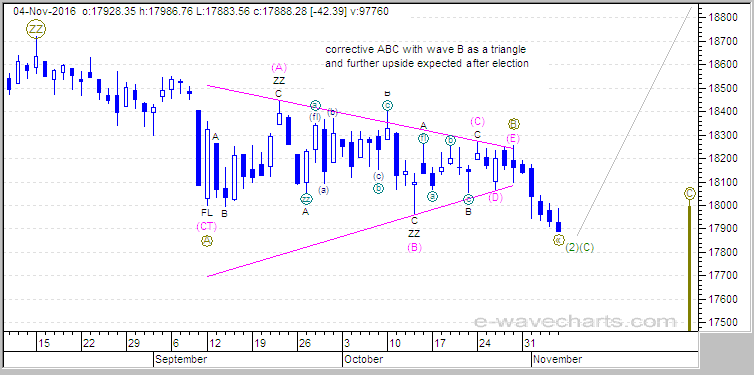
DOW - Elliott Wave Forecast for bullish reversal after the US election - Nov 4th 2016
Silver - Bullish Cup and Handle Pattern -Posted in members area - Mar 2016
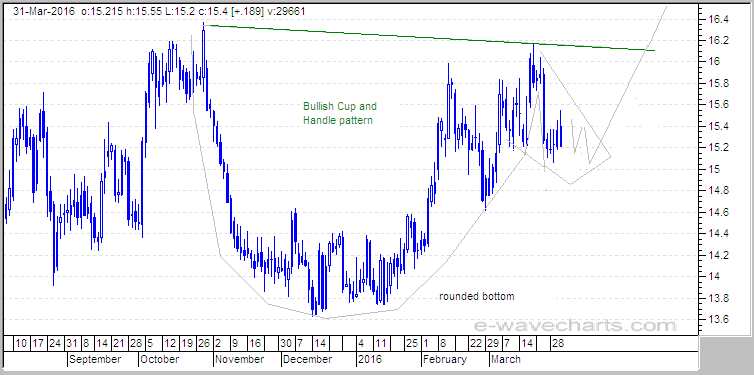
The charts below are older charts that were posted in the members area on the indicated dates.
Our members were aware of these trend changes before and then when they started.
Our Elliott Wave Forecast for the decline and triangle breakdown for Crude Oil - Oct 1st 2014
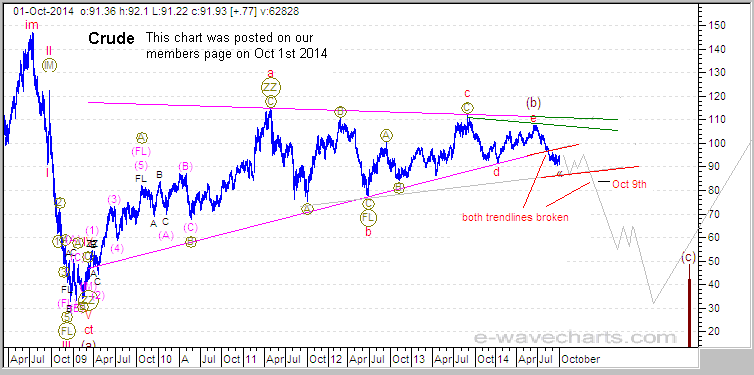
Our Elliott Wave Forecast for the decline and triangle breakdown for Crude Oil - Oct 14th 2014

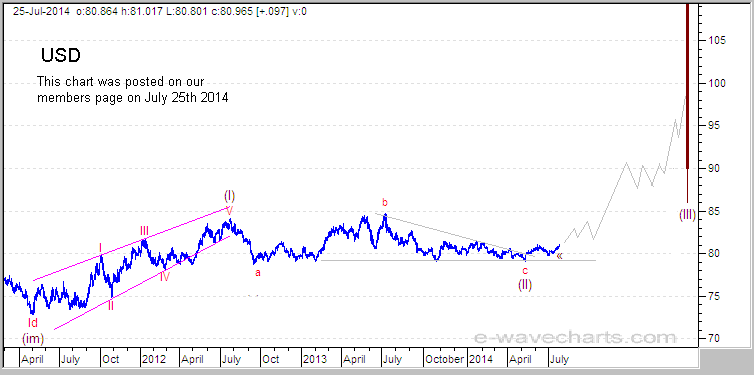
Our US Dollar Forecast- July 24th 2014
USD - July 24th 2014 - This chart illustrates our forecast for a rally in the USD
The Elliott Wave Chart Site offers Elliott Wave Analysis and Forecasts for the DOW, Nasdaq, S&P 500,(SPX), Crude Oil, Natural Gas (NG), Bitcoin, Gold, Silver, HUI, EURO and the USD.
Over years of Elliott Wave Forecasts and Analysis on the Web.
The subscription price still remains the same, at $19.99 / month.
Elliott Wave Natural Gas Charts
Elliott Wave Forecast on a Triangle Breakout for Gold Dec 18 2007
Dec 18 2007 - Gold Forecast - See it illustrated before it happens!!!
Check the dates in the top left corner. These are actual archived long term charts from the members area.
Notice the accuracy of the Elliott Wave Forecast and dates for the market turns.
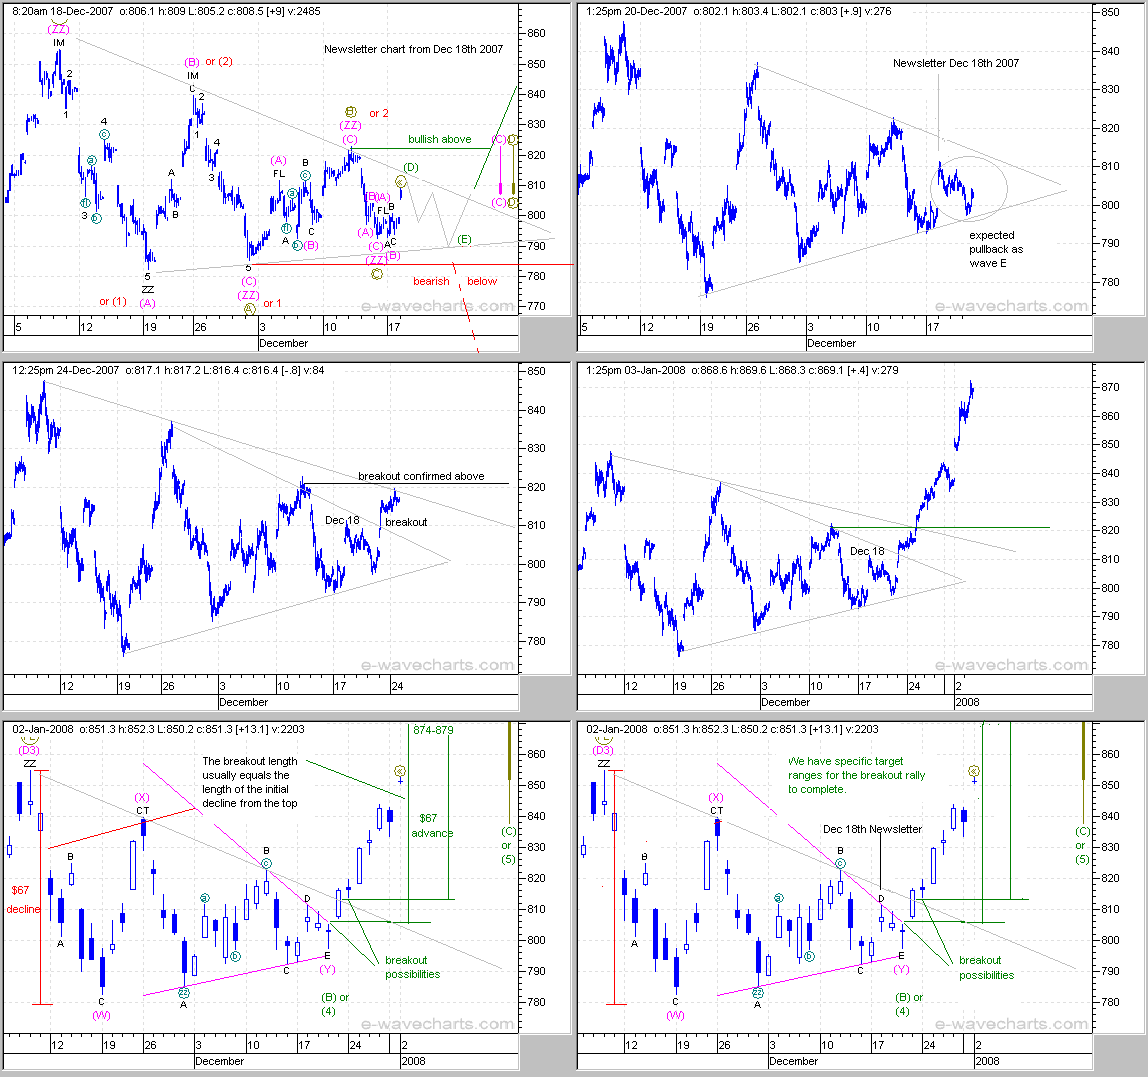
Another Triangle Breakout Example for GOLD
Elliott Wave Forecast and Technical Analysis Services
The detailed Short Term Elliott Wave Forecast is located on the Elliott Wave Subscribers page. The commentary is updated daily, including intraday commentary and chart updates. Fibonacci pivot dates and cycle analysis are also utilized to forecast reversal dates. The indices covered include the NASDAQ, DOW, S&P 500, SPX, Russell 2000 ETF (IWM), DOW Transports, TSX and DAX. Commodity charts include XOI, Crude Oil, Natural Gas, Gold, GLD ETF, Silver, SLV ETF and the HUI (Gold and Silver index).
Additional Elliott Wave charts cover the US Dollar (USD), EURO (FXE) ETF, CAD (FXC) ETF, 10 Year Treasury Note Yield (TNX), Financial Select SPDR Fund (XLF) and Bitcoin.
With Technical Analysis and our Elliott Wave Forecast, we can be on the right side of the market.
S&P 500 - Elliott Wave Forecast - 2007 Stock Market Top
This S&P 500 Chart was posted on our subscribers page

DOW - Elliott Wave 2008 wave (2) Stock Market Top
This DOW Chart was posted on our subscribers page

Crude Oil - Elliott Wave Forecast - 2008 Market Top
This Crude Oil Chart was posted on our subscribers page

More Elliott Wave charts forecasting the market crash
for the DOW, S&P500 and Nasdaq.
Live Streaming Technical Analysis Charts with Indicators
Gold Technical Analysis Chart - or Select your own symbols, indicators and timeframe
Gold Technical Analysis Charting Area
|
